Agent Loop Debugger: a Pi extension to understand how Pi runs your code
A few weeks ago I realized that I use Pi every day, but I had no clear way to see what it is doing behind the interface. I know when it replies, I know when it calls a tool, but I do not see the full flow: when the system prompt is assembled, which tools are active, when a turn starts, when it ends, what the provider returns to the model.
That lack of visibility is a didactic problem. If we really want to understand how an agent harness works, we need to see its internal events. That is how Agent Loop Debugger was born: a Pi extension that starts a local server and serves a webapp to inspect the agent loop in real time.
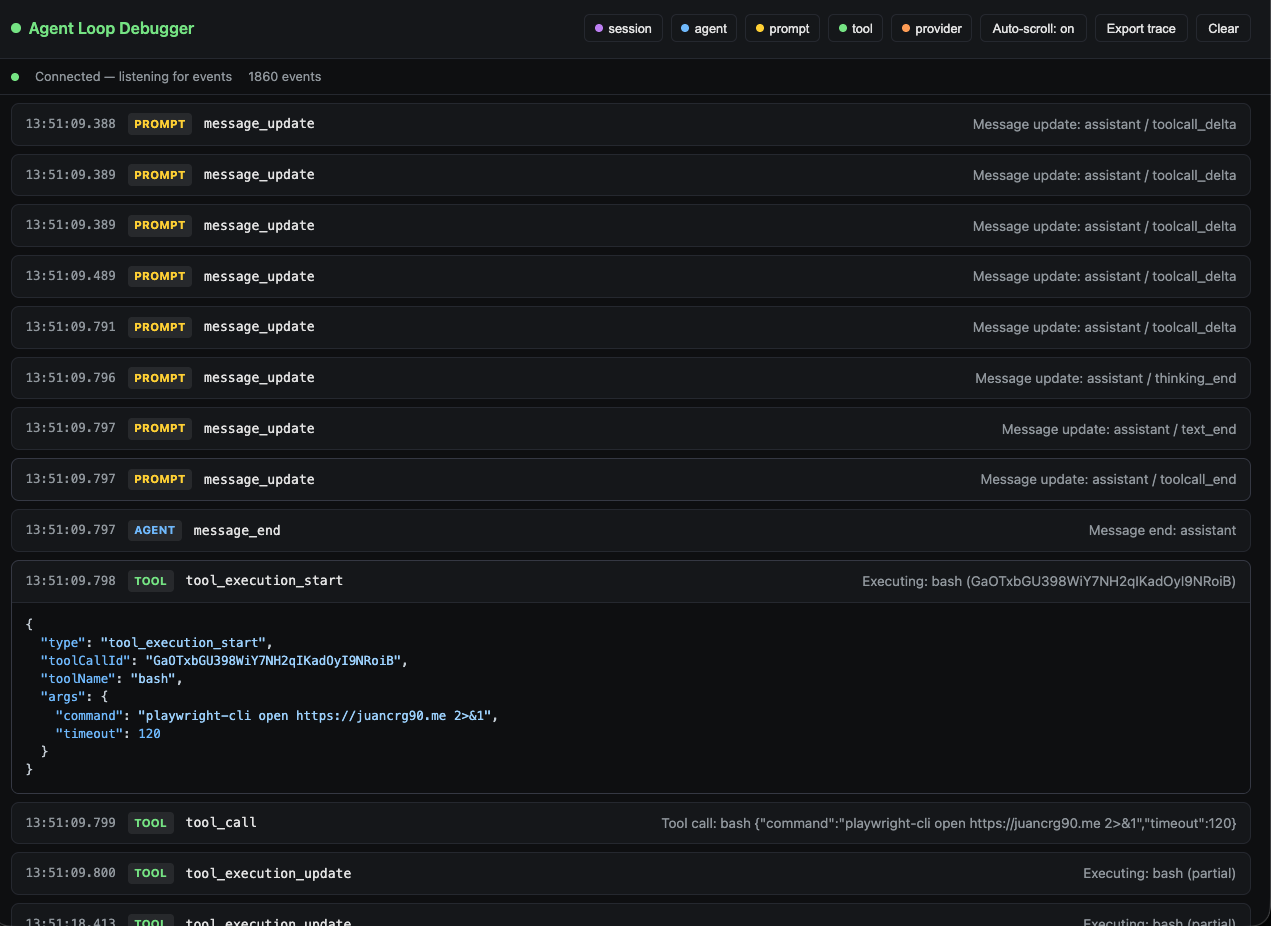
The problem: the harness is a black box
Pi, like other modern coding assistants, works as a loop:
- It receives your message.
- It assembles the context (system prompt, previous messages, active tools, context files, skills).
- It sends everything to the model provider.
- It receives the response token by token.
- If the model decides to call a tool, it executes it.
- It receives the result and repeats until the turn ends.
That sounds simple, but dozens of events happen inside the harness that you never see: before_agent_start, context, message_start, message_update, tool_call, tool_execution_start, after_provider_response, agent_end, and so on. Each of those events is an opportunity to understand why the model did what it did.
Without a way to see them, debugging strange behavior becomes guesswork. Why did the model not use a tool? What system prompt did it receive? How much context did each part consume? What events fired in what order?
The solution: a webapp that listens to the loop
Agent Loop Debugger is a Pi extension written in TypeScript. It loads with Pi, registers handlers for the lifecycle events, and exposes a local HTTP server with Server-Sent Events. The webapp connects to that server and draws a timeline with every event.
Installation is straightforward:
pi install npm:@juancrg90/agent-loop-debugger
Once installed, inside Pi you run:
/agentloop
This starts the server and prints a local URL, for example http://127.0.0.1:54321/. Open it in the browser and you start seeing events in real time.
What the timeline shows
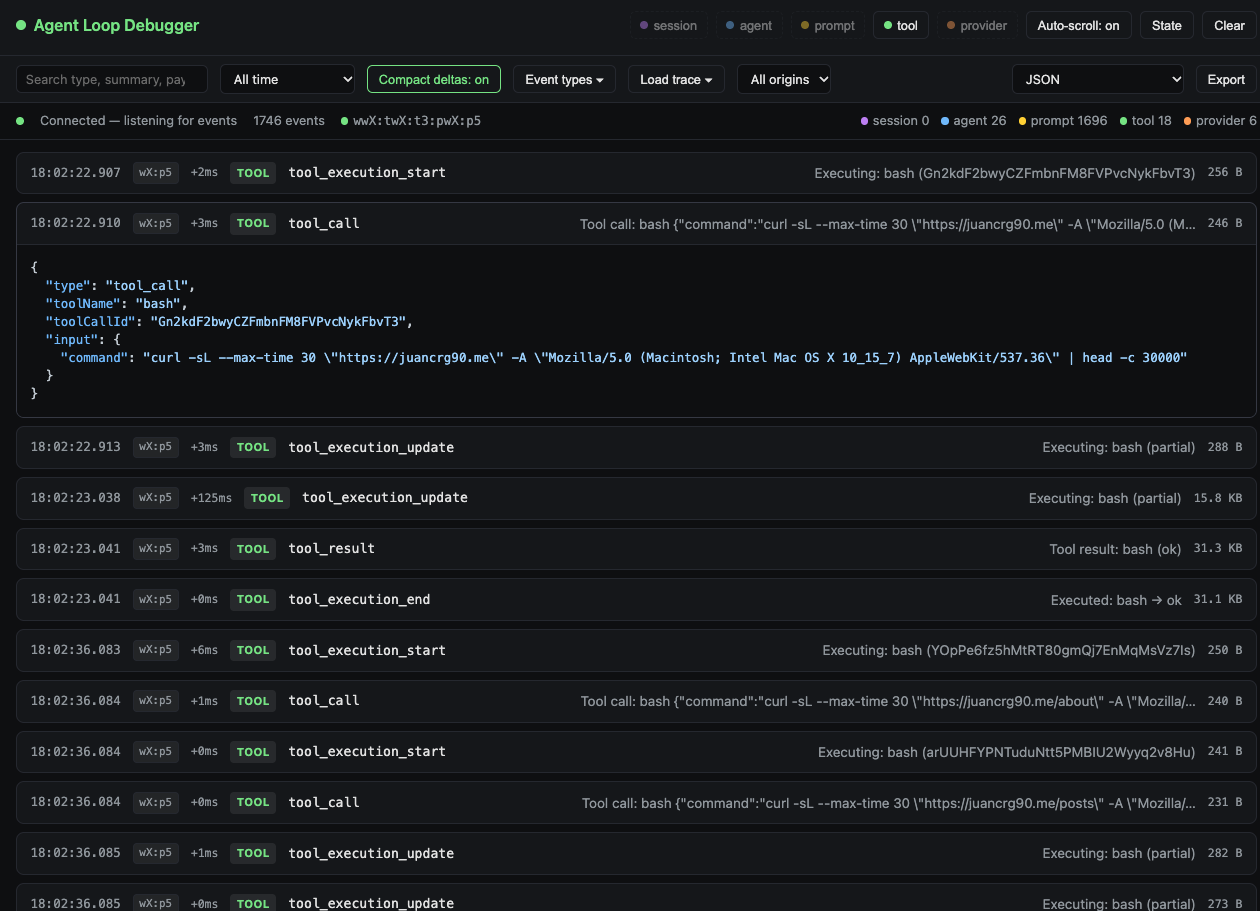
Each row in the timeline represents a harness event:
- Timestamp relative to the previous event and latency since it.
- Category:
session,agent,prompt,tool,provider. - Type:
before_agent_start,tool_call,message_update, etc. - Summary: a readable one-liner with the relevant details.
- Payload size to detect heavy events.
Clicking a row expands it and shows the complete payload as highlighted JSON. This is useful to see exactly what arguments a tool received, what content arrived in a delta, or what the full context looks like.
Compacting deltas
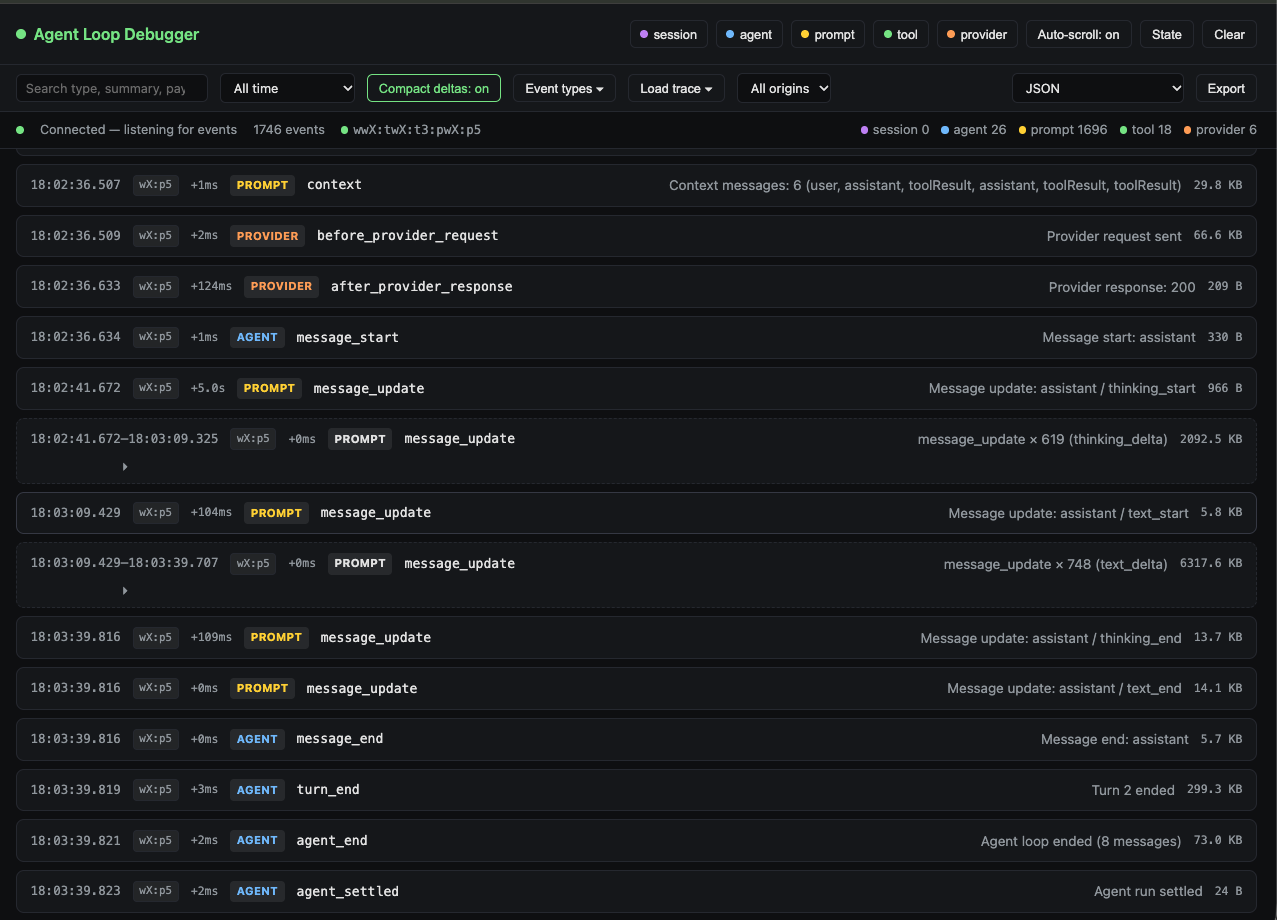
One of the first frictions I found was noise. When the model generates a response, it can produce hundreds or thousands of message_update events of type text_delta. That saturates the UI.
The extension solves this with a Compact deltas mode: when it detects three or more consecutive message_update events of the same type, it collapses them into a single row like message_update × 619 (thinking_delta). You can expand that group to inspect every individual delta if you need the detail.
Filters and search
Besides the timeline, the webapp includes controls to cut the noise:
- Category filter: session, agent, prompt, tool, provider.
- Event type filter: discovered dynamically as events arrive.
- Text search: searches the event type, summary, and payload.
- Time range: last 30 seconds, 1 minute, 5 minutes, or all time.
This lets you, for example, see only tool_call events from the last two minutes, or search for a specific path inside the payloads.
Trace persistence
Another common problem is that events disappear when you close Pi. To preserve them, the extension automatically saves the event buffer as a JSON file in:
~/.pi/agent/agent-loop-debugger/traces/agent-loop-<timestamp>.json
You can list saved traces with:
/agentloop list
And load one back with:
/agentloop load <index|filename>
This is useful for analyzing a complex session later or sharing what happened with someone else.
State inspector
Seeing events is one thing; understanding the state that produced them is another. The webapp includes a side State panel with three tabs:
- System prompt: the assembled system prompt for the current turn.
- Tools: all registered tools, marking which ones are active.
- Context: token usage, context window size, and consumed percentage.
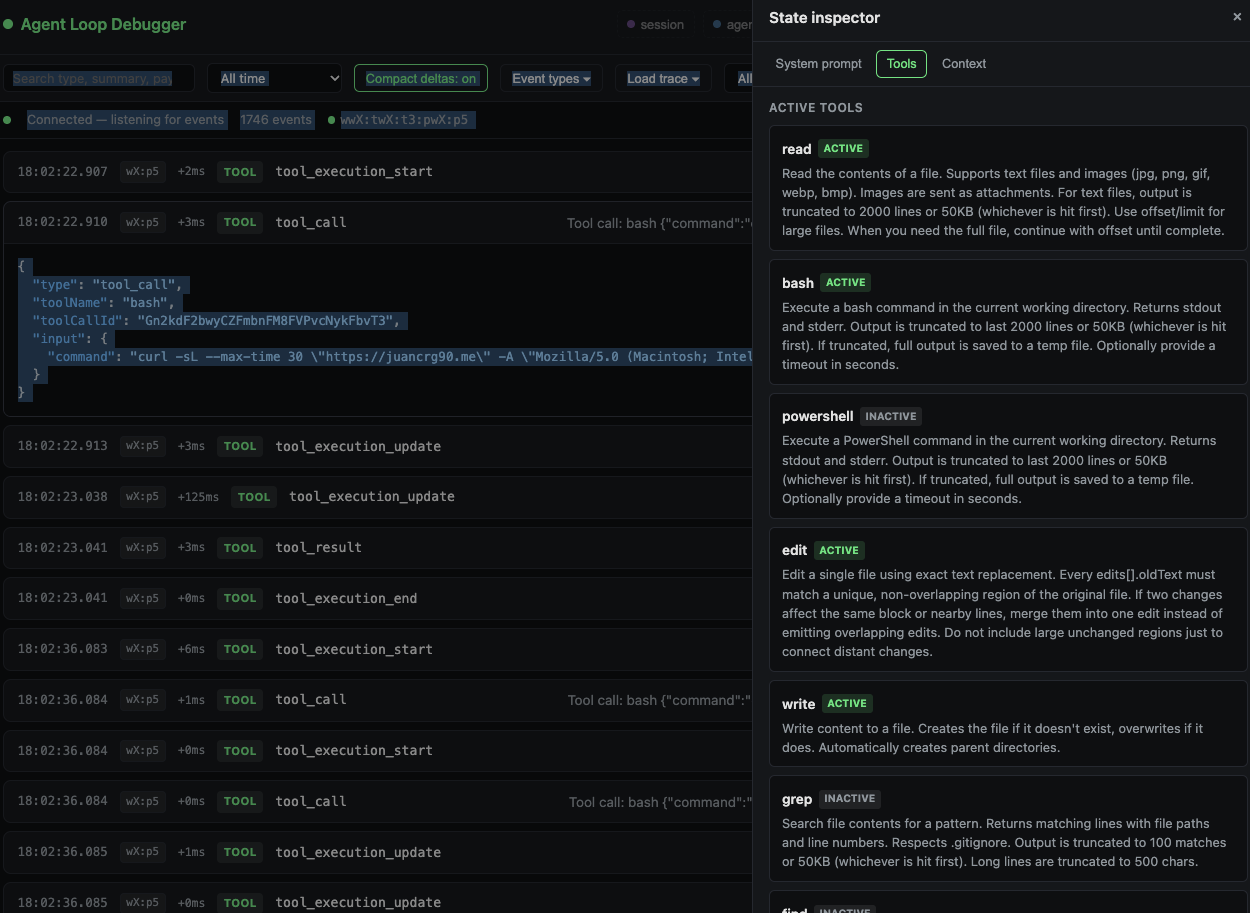
This answers questions like: which skills were loaded? which context files entered the prompt? which tools does the model see? how much context do they consume?
Herdr awareness
Since I work with Herdr and multiple orchestrated agents, I added support for detecting when Pi runs inside a Herdr pane. The extension reads HERDR_PANE_ID, HERDR_TAB_ID, and HERDR_WORKSPACE_ID, and attaches that metadata to every event.
In the UI this shows up as an origin badge next to the timestamp, a filter by pane, and a compact indicator in the status bar. If you run /agentloop in several agents at the same time, each gets its own server, but you know which pane every event came from.
/agentloop --herdr
Prints the current Herdr context if available.
Didactic value
The main reason I built this extension is not just to debug faster, but to learn. Pi is a sophisticated harness, and many of its decisions—which tools to activate, how to assemble the prompt, when to compact context—stay hidden.
By watching the events in chronological order you can understand:
- How the system prompt changes between turns.
- How large the overhead of tools and skills is.
- How many tokens each message and each tool call consumes.
- How
tool_call,tool_execution_start, andtool_resultrelate to each other. - What the provider returns in
after_provider_response. - How the loop behaves when something fails.
For me, that visibility turns Pi from a black box into a comprehensible system.
How it is built
The extension is a TypeScript package inside the pi-extensions monorepo. It has no runtime dependencies outside Node and the Pi APIs. The webapp is a single HTML file with embedded CSS and JavaScript, no frameworks, so it is easy to distribute.
The architecture is simple:
src/events.tsnormalizes events and keeps a bounded ring buffer.src/server.tsserves the webapp and an SSE endpoint.src/trace.tssaves and loads traces to disk.src/index.tsregisters Pi handlers and the/agentloopcommand.public/index.htmlis the webapp.
The code is on GitHub under the MIT license, so you can install it, modify it, or study it.
Conclusion
If you use Pi and have ever wondered what is happening behind the conversation, I recommend trying Agent Loop Debugger. It not only helps you debug; it teaches you the mental model of the harness.
Install it with:
pi install npm:@juancrg90/agent-loop-debugger
And start it with:
/agentloop
The source code is at github.com/JuanCrg90/pi-extensions.