Tuning Qwen3.8 on a 16 GB GPU: Crashes, Thinking Budgets, and Compaction
I decided to test Qwen3.8 after watching this YouTube video. It prompted a practical question: could I make the model useful as a local coding agent on my own 16 GB GPU?
Getting the weights to load was only the first gate. The first configuration hung the GPU, a later one generated an enormous reasoning-only response without reaching a write tool, and then long sessions exposed a third limit in the agent's compaction path.
Those failures looked related because they all ended with an unhelpful run. They were not. The GPU watchdog, the model's reasoning allowance, and the summarizer's output allowance were separate systems with separate controls. Treating them as one generic “memory” problem would have made diagnosis harder.
This is a record of one experiment, not a universal tuning recipe. I tested Qwen3.8-27B-GSQ-RCO-IQ3_S-mtp.gguf, a 12,120,016,960-byte community artifact—about 11.29 GiB on disk.
| Component | Tested setup |
|---|---|
| GPU | Gigabyte RTX 5060 Ti Aero OC, 16 GB GDDR7 |
| CPU | AMD Ryzen 5 9600X, 6 cores / 12 threads |
| System RAM | Crucial Pro 96 GB DDR5 |
| Storage | Crucial T500 1 TB NVMe |
| OS / GPU driver | Pop!_OS 24.04 LTS / NVIDIA 595.104.02 |
| Inference backend | llama.cpp 0.7.0-dev, build 11716, commit 797de63b2 |
| Proxy / agent | llama-swap v265 / Pi 1.3.0 |
The GGUF reports architecture qwen35; that is a loader identifier, not evidence of a different model identity. I did not verify that this community file is an official or unmodified base checkpoint, and I am not making claims about what its GSQ/RCO labels mean. Its file size is also not a measurement of total VRAM use: runtime buffers, context, KV cache, and other allocations matter. A 16 GB card loading this exact quantization says nothing universal about every 27B quantization.
Failure one: the GPU stopped responding
My initial test ran for two hours with high thinking and no separate reasoning-token cap within the overall response allowance. The NVIDIA seven-second watchdog reported ten hangs, with Xid 8 events involving llama-server. Each was followed within five seconds by Pi reporting Stream ended without finish_reason; CUDA launch timeout/termination and proxy exits corroborated that the backend had stopped responding.
More time did not make this better. I did not conclude that the cause was out-of-memory, a defective GPU, or a universally broken model. Those conclusions were not supported by the evidence. I also did not disable the watchdog, upgrade the driver, reduce the context, or turn off MTP as part of the fix.
Instead I made one backend change: disable CUDA graphs for this model process, while retaining MTP. The local binary supported GGML_CUDA_DISABLE_GRAPHS=1; related community reports in llama.cpp issue 27330 made that a plausible experiment, not a guarantee for other systems.
The model-specific llama-swap entry below shows the relevant shape. The loopback address is intentional; the path is a placeholder, not a real machine path. The existing sampling and backend flags are included to make the tested configuration legible.
# llama-swap config excerpt
models:
  "Qwen3.8-27B-no-cuda-graphs-r8k":
    cmd: >-
      llama-server
      --port ${PORT}
      --host 127.0.0.1
      --model /path/to/Qwen3.8-27B-GSQ-RCO-IQ3_S-mtp.gguf
      --alias Qwen3.8-27B
      --n-gpu-layers 99
      --ctx-size 65536
      --cache-type-k q4_0
      --cache-type-v q4_0
      --flash-attn on
      --spec-type draft-mtp
      --spec-draft-n-max 2
      --temp 1.0
      --top-p 0.95
      --top-k 20
      --min-p 0.0
      --reasoning-budget 8192
    env:
      - "GGML_CUDA_DISABLE_GRAPHS=1"
    ttl: 1800
    useModelName: "Qwen3.8-27B"
Start the proxy separately with its listen address, rather than an invented YAML host field:
llama-swap --config /path/to/config.yaml --listen 127.0.0.1:8080
This is the final R8K profile, shown together for reproducibility. The first graphs-off experiment changed only the environment variable; the reasoning-budget flag came later.
The environment variable has to reach the llama-server child process; exporting it in an unrelated Pi terminal is not equivalent. With this build, presence of the variable disables graphs, so remove it to revert—do not set it to 0 and assume that means false. After changing a model entry, let an active inference finish before reloading or restarting an idle proxy. This is not a blanket instruction to kill a server.
With graphs off and MTP retained, I ran a 61-minute-31-second soak: eight valid streams and 131,072 generated tokens, with no watchdogs or restarts. Each synthetic response intentionally hit a 16,384-token output cap. That establishes infrastructure survival for this run, not useful coding behavior, a throughput gain, or a causal explanation of the original hangs. I did not record a comparable throughput benchmark.
Failure two: a response spent its life thinking
Graphs off stopped the observed watchdog pattern, but the first real high-thinking benchmark still stalled after its initial file inspection. One subsequent response spent 32,768 tokens in thinking and produced no normal text or tool calls. Generation stopped about 13 minutes after it began; Pi then idled for roughly 107 minutes until the two-hour session lifetime ended. A two-hour allowance was not two hours of continuous model generation. There were no GPU events. This was a length/response-budget outcome, not a stream failure.
The correction was not to reduce the model context. I kept the backend context at 65,536 and the Pi profile's maximum response at 32,768, and added a server-default reasoning budget of 8,192 tokens. That budget limits the thinking portion; it leaves potential response capacity for normal content and tools. An API request can override the server default with reasoning_budget_tokens, so the configured default is not an unbreakable policy boundary.
Here is the matching Pi models.json profile shape. The dummy key is only an API-client placeholder for a local endpoint.
{
  "providers": {
    "llama": {
      "baseUrl": "http://127.0.0.1:8080/v1",
      "api": "openai-completions",
      "apiKey": "dummy",
      "models": [
        {
          "id": "Qwen3.8-27B-no-cuda-graphs-r8k",
          "name": "Qwen3.8-27B-no-cuda-graphs-r8k",
          "reasoning": true,
          "contextWindow": 65536,
          "maxTokens": 32768,
          "thinkingLevelMap": {
            "off": "none",
            "low": "low",
            "medium": "medium",
            "high": "xhigh"
          }
        }
      ]
    }
  }
}
The GGUF's chat template supports reasoning-effort labels and enable_thinking; it accepts xhigh, medium, and low, and the profile maps Pi's high to xhigh. Those labels supply qualitative instructions through the template. They are not hard token budgets. The --reasoning-budget 8192 server default is the actual numerical cap in this configuration.
I checked the behavior with a deliberately smaller probe cap of 12,288 tokens: it re-tokenized 8,192 reasoning tokens, then produced 13,901 characters of ordinary output. That probe's cap was intentionally different from the profile's 32,768 maximum. A separate high-thinking scratch test invoked a write tool and ended normally in 7.02 seconds. Neither small test proves general quality, but they showed that reasoning could end and leave room for ordinary output and tool use.
The longer game-coding run delivered a normal final answer after 89 minutes 34 seconds and completed nine successful compactions. The model claimed 33 tests; I did not independently score that run. It exposed another failure class.
Failure three: compaction had its own ceiling
Pi's compaction summaries are not simply ordinary model responses with the profile's maxTokens copied across. In this setup, history summary output is bounded by the smaller of 80% of reserveTokens and the model's maxTokens. Split-prefix summaries use half the reserve. The context threshold that triggers compaction depends on context size minus the reserve. keepRecentTokens controls how much recent history is retained verbatim, not that trigger calculation.
With defaults of reserveTokens: 16384, keepRecentTokens: 20000, a 65,536-token context, and 32,768 maximum response tokens, the threshold was above 49,152. The history-summary allowance was 13,107 tokens and the split-prefix allowance 8,192. Successful summaries had already ranged from 4,298 to 34,969 characters, and two unpersisted summaries hit the 13,107-token cap—one after the normal final answer. Raising or retaining the ordinary response limit did not remove this distinct compaction cap. Pi rejects length-limited summaries rather than saving incomplete checkpoints. The failed UI error text was not fully persisted; I diagnosed these attempts by correlating backend token counts, missing checkpoints, and the installed rejection logic. Existing history, earlier summaries, and source files remained; a failed compaction was not an application rollback.
I tested a per-model settings override for only this llama model, increasing the reserve and reducing recent history. The example is a settings fragment, not part of models.json or llama-swap configuration:
{
  "compaction": {
    "modelOverrides": {
      "llama/Qwen3.8-27B-no-cuda-graphs-r8k": {
        "reserveTokens": 24576,
        "keepRecentTokens": 8192
      }
    }
  }
}
At those values, the trigger threshold moves above 40,960; the history-summary allowance rises to 19,660 tokens and split-prefix allowance to 12,288. The reserve is not a guaranteed output allotment: the summary cap is still calculated from it, and the context threshold changes too. I tested the settings resolver and checked that unrelated models remained unchanged. I used fresh sessions; the old compaction artifact was not rewritten.
This improved the headroom, but it did not fully fix compaction. In the final run, the normal final answer arrived after 74 minutes 15 seconds, with six successful compactions; at least one summary still reached the new 19,660-token cap and later recovered. I would not describe that as “compaction solved.” It is a measured improvement in one configuration with a remaining observed edge case.
What the final run says—and what it does not
The final game run scored 71/80 in a one-run evaluation: 45/50 functionality, 13/15 visual, 10/10 robustness, and 3/5 code/docs. It had 31 tests and an independently passed build in an isolated copy. Browser checks included four genuine keyboard-only wins, a natural loss, pause, ten restarts, best-record comparisons and reloads, plus hidden-tab and stale-key behavior. There were no page exceptions or unexpected requests.
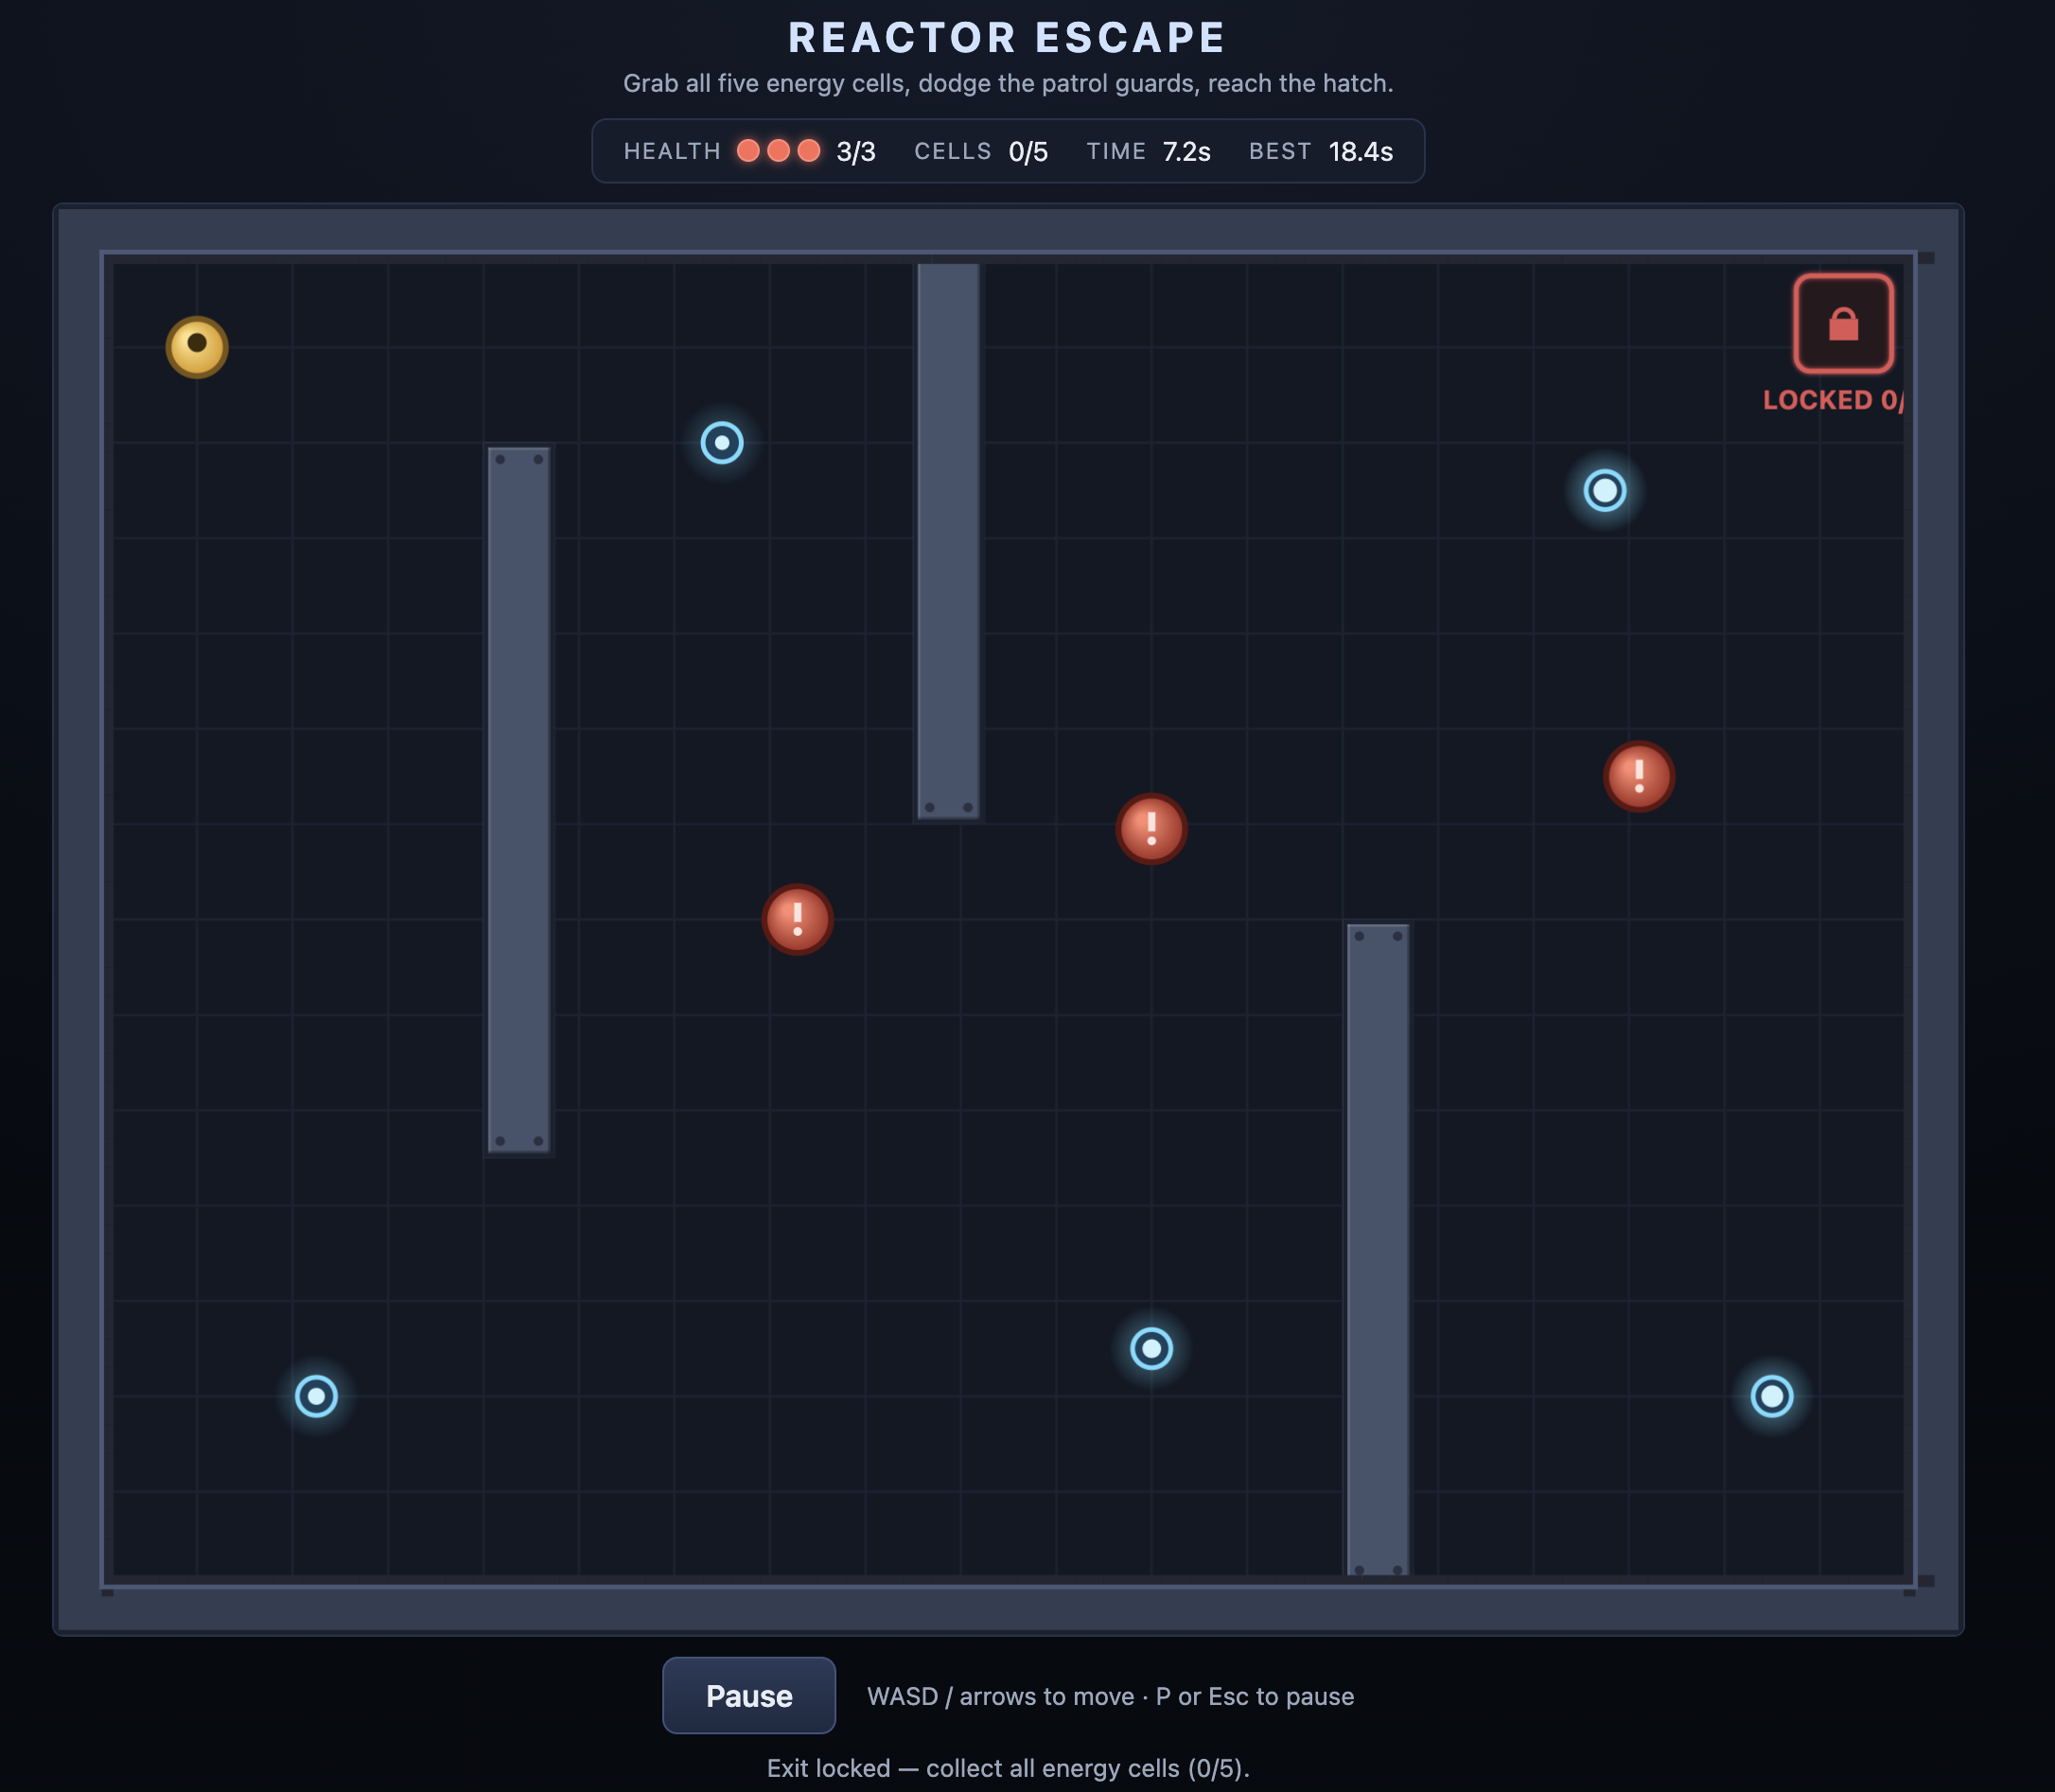
Reactor Escape during gameplay. The screenshot illustrates the interface; the score above comes from separate behavioral checks.
The score is evidence of a useful result, not proof of perfect application quality. The patrol overshoot is clamped and discarded, which produces about ten world-units of phase drift over ten seconds and timestep-dependent enemy positions. A minor exit-count label is clipped at the border. The README overstates FPS equivalence, and the tests miss exact patrol timing. I did not repair these defects in this experiment.
The scores also do not cleanly compare high versus low thinking. This was one stochastic run, phases changed, and the all-clauses-or-zero checklist plus a single coordinator visual rating are coarse measures. I have no defensible causal claim about speed or accuracy from them. Likewise, the soak's clean infrastructure result is not coding quality, and the final score is not a universal capability claim.
Practical boundaries
The useful configuration here was a collection of scoped controls: CUDA graphs off for the problematic backend run, MTP retained, an 8,192-token server-default reasoning budget, a 32,768-token ordinary profile maximum, and a model-specific compaction override. Each addressed a different observed limit. The exact hardware, GGUF, loader build, proxy, agent, and workload matter.
System RAM and VRAM are not interchangeable. The machine's 96 GB of CPU memory does not show that CPU RAM solved GPU watchdog hangs; I did not establish that. Nor does a 12.1 GB file guarantee that all runtime allocations fit in 16 GB. The four slots reported by the backend were not four concurrent clients and do not imply fourfold memory capacity. I did not set --parallel 1 as a remedy.
If I repeated the experiment on another machine, I would preserve the original settings, change one factor at a time, and stop to investigate a new Xid rather than treating it as an ordinary slow response. I would distinguish a backend stream ending, a response reaching its token budget, and a compaction summary reaching its own cap before changing anything. That separation made this run understandable—and made the remaining limitations visible instead of hiding them behind a single “it works” claim.
One other detail matters when reading the run logs: exit code 124 was not necessarily a failed handoff. In the final run, deadline-after-agent-completed meant the interactive launcher expired after the model had already submitted its final answer. Quality, completion, agent wall time, inference throughput, and rendering performance are different measurements.
References and reproducibility
The measurements above come from the saved October 20–21, 2026 experiment sessions, isolated build/test logs, browser evidence, and an independent artifact evaluation. The model SHA256 recorded during documentation was 58fd826723939933dc86f45b7fe04545cbc2de1c70f6fe2cdd3858c87a98c12f. That identifies the file currently on disk; it is not a claim that the harness captured a model hash at every earlier run's start.
- Related Blackwell CUDA-graphs issue: still open when checked; user reports support a workaround, not a universal upstream fix.
- llama.cpp server documentation at the tested commit.
- llama-swap configuration example at v265.
- Pi compaction reference. The calculations here were also checked against the installed Pi implementation; later versions may differ.